Oahu Tide Chart
The Surf Chronic interactive tide chart for Oahu, powered by official NOAA tide predictions. Pick a side of the island and a date, and see exactly what the tide is doing — at a glance. enjoy!
Click to View the Oahu Tide Chart
The Chart
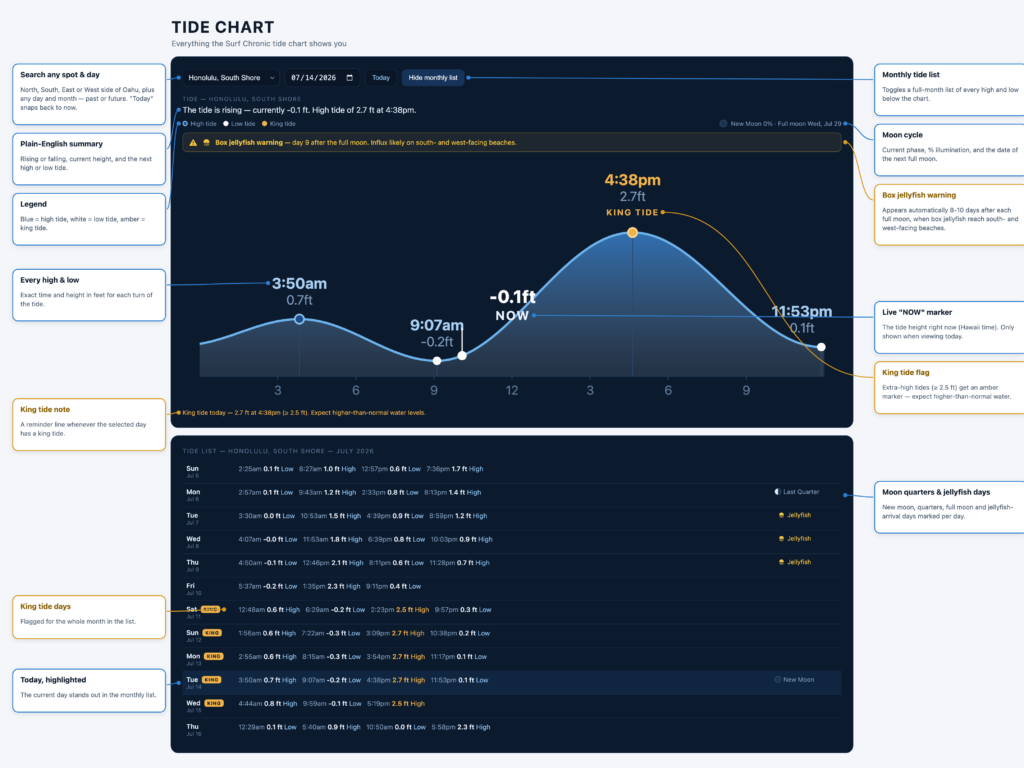
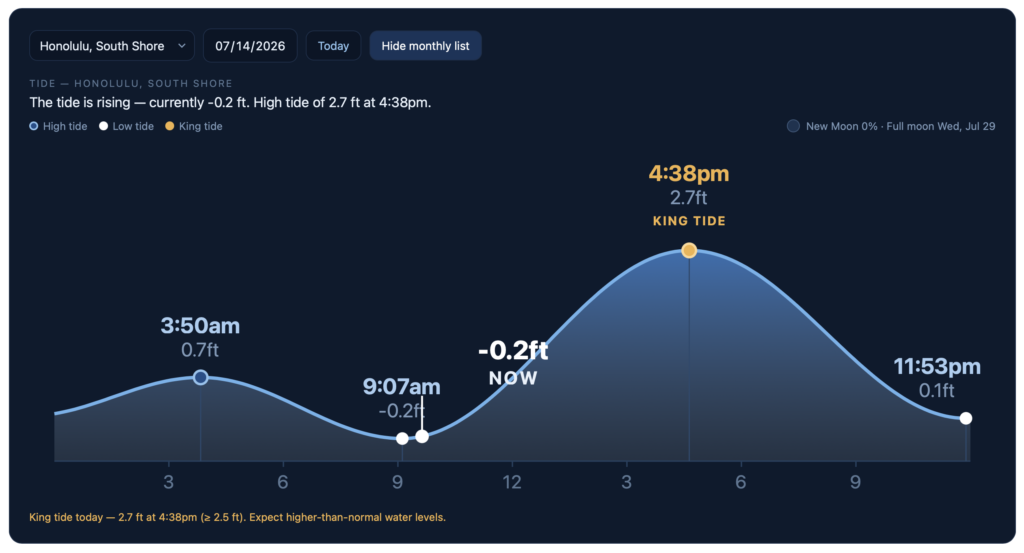
- Tide curve — a smooth graph of the full day’s tide, from midnight to midnight
- High & low tides — every high and low marked with its exact time and height in feet
- Live “NOW” marker — when viewing today, a marker shows the current tide height and whether the tide is rising or falling, plus the next high or low coming up
- Plain-English summary — e.g. “The tide is rising — currently 1.5 ft. High tide of 2.6 ft at 3:11pm.”
Search
- By location — choose your side of the island:
- North Shore (Haleiwa)
- South Shore (Honolulu)
- East Side (Kaneohe Bay)
- West Side (Waianae)
- By date — jump to any day and month, past or future, or tap Today
Monthly Tide List
Tap Show monthly list to see every high and low tide for the whole month below the chart — times, heights, and tide type for each day, with today highlighted.
King Tides
Extra-high tides are flagged automatically. King tide days get an amber marker on the chart, a warning note, and a KING badge in the monthly list — expect higher-than-normal water levels on those days.
Moon Cycle
- Current moon phase with icon and illumination percentage
- Date of the next full moon
- New moon, first quarter, full moon, and last quarter days marked in the monthly list
Box Jellyfish Warning
Box jellyfish typically arrive on Oahu’s south- and west-facing beaches 8–10 days after the full moon. On those days the chart shows a yellow warning banner, and the monthly list tags each jellyfish day — so you know before you paddle out.
Tide predictions from NOAA (Honolulu, Haleiwa, Kaneohe Bay, and Waianae stations). Times are Hawaii Standard Time; heights in feet relative to MLLW.