How to use this surf report
Live conditions for Oahu surf spots on all four sides of the island, refreshed every hour, with a spoken report twice a day, the National Weather Service outlook, live wave buoys, an animated swell map, a wave chart running 3 days back and 5 days ahead, and an hour-by-hour wind chart. Every spot card adds a 5-day forecast, why it is or isn’t working, lifeguard and hazard notes and lineup shots from local surfers, and opens a page of its own with more detail. Official National Weather Service numbers lead; Surfline’s spot-by-spot forecast sits alongside as the second opinion. Tap a heading to open it — they follow the page from top to bottom:
At the top
- Wave scale — Face / Hawaiian — Surfline and the National Weather Service report the full height of the wave face. Locals call it in Hawaiian scale, about half of that. The switch changes every surf height on the page — spot cards, featured spot, the four-shore outlook table and the wave chart — and remembers your choice. Buoy readings and the swell map stay as they are: those are open-ocean heights, not surf heights.
- “Live feed delayed” note — conditions update every hour. If a gold note appears under the title, our feed has been quiet for more than three hours and the numbers below are older than usual.
- Section bar — the four tabs under the title jump through the page: Report (featured spot and the audio report), Spots (the spot cards), Forecast (wave chart, warnings and the outlook) and Conditions (tide, buoys and wind). Tap one and the page glides there; the bar stays at the top while you scroll and the tab you’re in turns gold.
Today’s report
- Daily photo/video — when a shot or clip of the day is posted it leads the card; otherwise the Featured Spot takes that space. A sponsor card from one of our partners may appear after the audio report, podcast buttons and All reports.
- Featured spot — the standout spot right now, with its size, rating, wind and swell. The size follows the same rule as the spot cards. Under the numbers is the best window: when to go, worked out every hour from Surfline’s hourly wind and rating forecast for that spot — for example “Cleanest 6–8 AM, before the trades fill in”. It only looks at daylight hours still ahead, switches to tomorrow in the evening, and says so plainly when there is no clean window. Some days a hand-written summary replaces it. The gold button at the bottom opens that spot’s full page.
- Daily audio report — a spoken surf report made fresh twice a day, around 6 AM and 12 PM Hawaii time; the note by the date (“Updated 6:01 AM HST”) tells you which edition you’re hearing. It covers ocean warnings, sunrise and sunset, the tide, the wind on each shore, the key spots, the best bet of the day and what’s coming next (from the National Weather Service outlook). Spot sizes come from the National Weather Service shore forecast when it’s current, with Surfline’s estimate for the exact spot as the check. Heights in the audio are always wave-face heights.
- Player controls — the blue button plays and pauses, tap anywhere on the progress bar to jump, and the circled “10” buttons skip back or ahead ten seconds. If you’ve been here before, the latest report may start on its own — pause it any time.
- Read today’s report — the full text of the audio report, folded away under the player. Tap it to open. Pick an older day under All reports and the text switches to that day.
- All reports — opens the last 7 days of reports. Tap a row’s round button to play it (tap again to pause); the newest carries a yellow “Latest” badge, and “Back to latest” returns the player to today.
- Podcast & notifications — the same daily report is a free podcast. Tap Follow on Apple Podcasts or Spotify under the player, follow the show, and your phone gets a notification every time a new report goes out — handy on the drive to the beach. Watch on Apple Podcasts opens Surf Chronic Sessions, our video show filmed at the spots on the good days. Every app, plus our Surf Chronic Sessions video show, is on the podcast page.
Spot cards
- Surf on Oahu right now — the line just above the spot cards gives every shore’s surf height in one sentence, with the time it was updated and where the numbers come from (the National Weather Service shore forecast, or Surfline when that forecast is out of date).
- Go to surf spot — the gold pull-down above the tabs jumps straight to any spot’s card, grouped by shore, so you don’t have to scroll. It briefly outlines the card in gold so you can spot it. On a phone it floats at the top of the screen while you scroll through the cards, so you can jump again from anywhere.
- Shore tabs — filter by North Shore, West Side, South Shore or East Side. North and west fire in winter, south in summer, and the east side runs on trade wind swell.
- Sort — the row under the tabs reorders the cards: Conditions puts the best-rated spots first, Wave size the biggest, and Wind the offshore spots first (then cross-shore, then onshore, lightest wind first). Tap the lit button again to go back to the normal order. It works with the shore tabs and is remembered on your device.
- Rating badge — overall quality for each spot, on the same scale and in the same colours as Surfline, so it reads the way you already know it: Very Poor Poor Poor to Fair Fair Fair to Good Good Epic. The rating is Surfline’s, for that exact spot.
- Surf size — height in feet, shown in whichever wave scale you picked at the top. The big number is Surfline’s estimate for the exact spot; the National Weather Service shore forecast sits under it as the cross-check (✓ agree within a foot, △ disagree). If the NWS product is missing or a day old the cards fall back to Surfline.
- Wind & gusts — in miles per hour, and whether it’s Offshore (clean), Cross-shore, or Onshore (choppy) for that particular spot.
- Swell — height @ period in seconds, and the direction it comes from. Longer periods (14s and up) mean more powerful, better-organised waves. We only credit a spot with swell that can actually reach it: “wind swell” marks short-period chop from the trades, “wrapping in” means it comes from another side of the island and only bends into the spot, and “No north swell” means just that — it’s flat for a reason.
- Updated time — each card shows when its conditions were last fetched.
- Next 5 days — a box for each morning (6 AM–noon) and afternoon (noon–6 PM), today and the next four days, from Surfline’s forecast for that spot. The number is the surf size (it follows the Face / Hawaiian switch). The three bars under it are in the rating colour, the same as the badge, and their shape shows where the surf is heading: short to tall = rising, level = steady, tall to short = dropping. A solid gold ring marks a half-day rated Good or better; a yellow-to-green ring marks Fair to Good — it could turn good, but conditions change, so it’s a heads-up rather than a promise. Tap How to read this forecast under the boxes for a pop-up card with examples and the full colour key.
- Why it’s working (or not) — the boxed line checks the swell, size, wind and tide against what that spot likes, for example “NNW swell in its window, good size, offshore wind; but high tide now, better tide from 1 PM”. The coloured strip across the top gives the verdict at a glance: Working (green, everything lines up), Partly working (yellow, something’s off — often the wind or the tide) or Not working (grey-blue, wrong swell or size today).
- Safety — whether the lifeguard tower is staffed right now (towers run 8 AM–6:30 PM) or where the nearest one is, the spot’s hazards, any National Weather Service alert for that shore, and a link to the official hazard rating for the closest guarded beach.
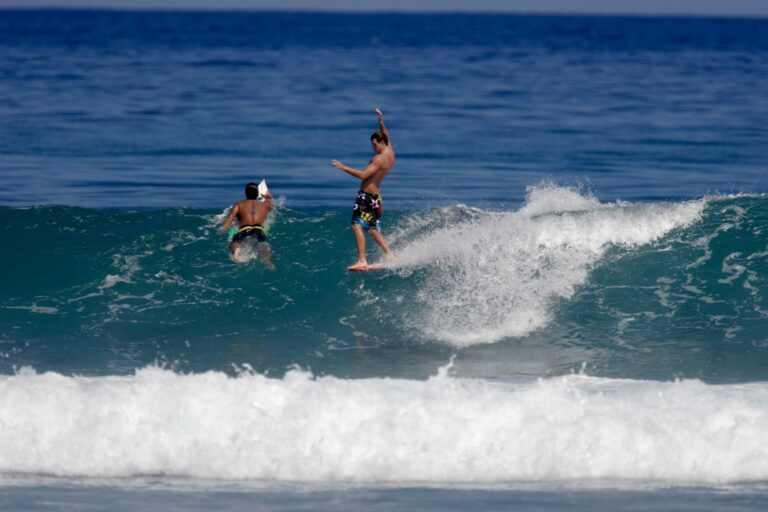
- Lineup photos & video — shots from local surfers, checked by us before they go up. The newest one leads its spot’s card with a “Lineup · 2 hours ago” label and the surfer’s Instagram or YouTube credit; tap the name to see their page. Upright phone shots are shown whole, not cropped. Videos have a Full screen button that plays them big with sound; for photos, tap the photo or Full screen to see it full size, then tap anywhere or × to close. A card with no shot yet invites you to be the first. Shots stay up until 10 AM the next morning or until a newer one comes in. Each spot’s page keeps its latest 3 shots until newer ones replace them.
- Surfed today? — tap the gold card or Upload to share your photo or clip with the Surf Chronic Ohana. Pick the spot and add your Instagram or YouTube name for credit. To be approved it has to be from today, clear, and show the surf.
- Share (the orange button at the bottom of each card) — sends the spot’s live numbers and a link to your crew. On a phone it opens your share sheet (Messages, Instagram, WhatsApp…); on a computer pick Facebook, X, Threads, WhatsApp, text, email or copy. The link preview shows that spot’s size and rating with its lineup shot or a spot card. The blue button beside it opens the spot’s page and 11-day forecast.
- 🔔 Alerts — the bell on each card and spot page opens your surf alerts for that spot: wave height, Good conditions, offshore wind, the tide you like and new lineup photos, by email or a notification on your phone. Ohana members can also build custom alerts for that spot from swell size, period and direction, wind and tide, starting from the spot’s ideal conditions. It turns yellow and says ON when your alerts cover that spot.
- Reports from the water — surfing or just checked it? Tap How’s your session? on a spot card (or answer it when you upload a lineup shot): better, as forecast or worse than the forecast, and how crowded. Each card shows what surfers said in the last 3 hours, so you know whether the numbers match what’s really happening.
- ★ My spots & Edit spots (Ohana Pass) — members tap the star on a card to pin that spot to the top and to a My spots tab, and use Edit spots to untick the spots they don’t want to see (Hide all and Show all do the lot at once). Both are saved to their account on every device. Join the Ohana to turn it on.
Spot pages
- A page for every spot — tap the blue 11-day forecast button on a card. Each page has the live numbers and lineup shot, the forecast (5 days, or all 11 with the Ohana Pass) and the swells in the water, when the spot works best (swell direction, size and tide), wind for that shore, the tide, the nearest buoy and any swell on its way, safety, a satellite map with directions in Apple or Google Maps, our guide to the spot, its lineup gallery and the other spots on that shore.
- Getting around a spot page — the bar at the very top jumps to the other spots on that shore (the dot is each spot’s rating colour) or back to all of Oahu. Right under it, the section bar has four tabs: Now (the live card), Forecast (the forecast and when it works), Conditions (wind, tide and buoys) and Guide (safety, map, ideal conditions, the spot guide, videos and photos). Tap one to jump there; the bar stays at the top while you scroll and the tab you’re in turns gold.
- 11-day forecast (Ohana Pass) — the same boxes as the cards (size, rating-coloured bars that rise, hold or drop, gold and yellow-to-green rings) for 11 days, with the wind under each box as speed / gust in mph, coloured by direction for that spot: green offshore (clean), yellow cross-shore, orange onshore (choppy). The colour key sits right under the table. Days 8–11 are a long-range outlook and change more. Without the Ohana Pass you see the first 5 days and the rest stays locked; members also get the wave chart 11 days out.
- Ideal conditions — the swell direction, wind, surf height and tide that make the spot fire.
- Map buttons — ≋ Reef lays the NOAA nautical chart over the satellite photo: depths in feet, reef and rock areas and channels (a guide, not for navigation). ◎ Me shows where you are (your phone asks first; your location stays on your phone) and how far you are from the spot, or the drive time to the parking on the Apple map. ⛶ Full screen opens the map big.
- Videos — some spots have a Videos box above the lineup shots: clips of the spot from YouTube or from us, with the filmer credited underneath.
- Spot guide — ability level (beginner, intermediate, advanced), then five bars, each with a short note: local vibe (welcoming → intimidating), crowd (mellow → heavy), spot rating (poor → perfect), shoulder burn (how hard the paddle is, light → exhausting) and water quality (clean → dirty). Below them: hazards, what board to bring, access & parking, the bottom and the best season.
- Bookmark it — save your break’s page to your home screen; it’s always the live report for that spot. Shared spot links open straight to the page.
Wave chart & swell map
- Swell map — wave height in the ocean around Oahu from the University of Hawai‘i’s PacIOOS wave model, which resolves the island down to about 500 metres. Colours follow the same scale as Surfline’s wave-height map, with the legend in feet under the map: navy and blue are small, green 5–6 ft, yellow 8, orange 10, red 15 and up. It shows what is arriving offshore — the surf at each break depends on how that swell meets the reef. The model runs about six days ahead; slide past that and the map fades with a note. Use + and − to zoom.
- Oahu / All islands — the switch above the map changes the view. Oahu is the close-up (about 500 m detail). All islands shows Niihau and Kauai through Maui to the Big Island from PacIOOS’s WaveWatch III Hawai‘i model (about 5 km detail), so you can watch a swell reach each island and see the calmer water in each island’s shadow. Same colours, slider and play button; your choice is remembered next time.
- Wave height chart — surf heights for the key spots: the last 3 days left of the dashed NOW line (our own hourly record) and the next 5 days to the right (11 with the Ohana Pass). These lines are Surfline’s forecast for each exact spot — the National Weather Service only forecasts two days, and only per shore — so a line can sit a foot or so off the shore number on the spot cards. The chips under the chart show each spot’s size at the selected moment; tap a chip to hide or show its line.
- Time slider & play button — one slider moves the chart and the map together in 3-hour steps; tapping the chart jumps there too. The round button plays the whole timeline. Press play on the audio report and the forecast animates along with it, starting from now. Touch the slider and it stops.
Warnings & outlook
- Ocean warnings — advisories in effect for Oahu only: high surf, wind, small craft, flooding, brown water and sewage spills. Red is a Warning (most serious), yellow is an Advisory or Watch, and green means nothing is in effect. Weather warnings come from the National Weather Service; brown water and sewage notices come from the Hawai‘i Department of Health, each with the date it was posted or last updated. Brown water notices drop off 36 hours after the state last issued them.
- First visit free — the first time you open the report you see all of it, no email needed. After that we ask for an email (free) to keep reading; Ohana members just log in.
- Open during warnings — while a High Surf, Hurricane, Tropical Storm or other ocean warning is in effect for Oahu, the whole report opens to everyone, no email needed, with a red note at the top saying why. Watches and advisories don’t open it.
- Surf outlook — straight from the National Weather Service forecasters in Honolulu: their own write-up of what’s coming, above a table of expected face heights for the north, west, south and east shores, morning and afternoon, for the two days they publish. It’s refreshed each time they issue a new forecast, usually twice a day, and it’s the quickest way to see a new swell on the way. The height colours are Surfline’s rating for that shore, the average of its spots for that half-day: orange poor, yellow poor to fair, green fair, teal good and purple very good to epic. Hover or press a number to see the rating.
Tide
- Tide chart — today’s tide curve for Honolulu. Dark blue dots are high tides, white dots are low tides, and the white “NOW” marker is the current level. Tap the “Full Tide Chart” badge for the monthly tide calendar.
- Sunrise & sunset — the sun chip gives today’s sunrise and sunset times, and the chart is shaded darker for the hours before sunrise and after sunset.
- King tide — a gold dot and flag mark unusually high tides (2.5 ft and up). Expect higher-than-normal water levels and some shoreline flooding.
- Moon cycle — the moon chip shows the current phase, how lit it is, and the date of the next full moon (tides follow the moon).
- UV index — the day’s peak UV for Honolulu and when it hits, coloured from green (low) to purple (extreme). At 8 and up you burn in well under half an hour; reef-safe sunscreen and a rash guard help.
- Box jellyfish warning — a gold banner appears 8–10 days after each full moon, when box jellyfish typically reach south- and west-facing beaches.
Forecast accuracy
- Our scorecard — every hour we write down what the PacIOOS SWAN model and Surfline say a buoy will read 24 hours later, then check it against what the buoy actually measured. “0.6 ft off on average” is the typical miss over the last 30 days, “82% within 1 ft” how often the forecast was close enough to plan on, and “runs high / low” which way it leans. The better model on each buoy is outlined in green. Open-ocean heights, not surf heights — and nobody edits the numbers.
Wave buoys
- Measured right now — live readings from the buoys off Waimea Bay (north), Mokapu Point (east) and Barbers Point (south), updated every half hour: total wave height, period and direction, the long-period swell split from local wind waves, water temperature, and a 5-day trend line. A long-period swell climbing on a buoy is the first real sign of new surf, hours before it shows at the beach. A greyed-out buoy is offline.
- Early warning — offshore buoys — NOAA buoys 150–250 miles out in the open ocean (northwest, northeast, west and southwest of the islands). A swell passes them 8–24 hours before it reaches Oahu, so each card says which shore that swell is heading for and roughly when it arrives — longer-period swells travel faster. A gold New swell tag means the height jumped or the period suddenly got longer in the last 6 hours: the classic first sign of a fresh swell (gold card). A blue Incoming card is swell heading our way at a steady size; a faded grey Past Oahu card won’t bring surf. The map shows where each buoy is, with an arrow for the way its swell is travelling and a dashed line to the shore an incoming swell will reach; each card’s compass, the angle it comes from in degrees (0° = north, 90° = east) and the buoy’s latitude/longitude give the exact numbers. Tap the heading to fold the section away. “Past Oahu or heading away” means that buoy’s swell has already gone by the island or is moving away, so it won’t bring surf.
Wind, hour by hour
- Four rows, one per shore — each bar is one hour of forecast wind (height = mph, the number sits on every third bar), from now through tomorrow. Green is offshore (blowing from the land, grooms the waves), yellow cross-shore, orange onshore (choppy). The dashed blue line is midnight. In Hawaii the wind, not the swell, usually decides whether it’s worth going — look for the green stretch on your shore and go then. Hover or tap a bar for the exact hour.
Where the numbers come from
Surf heights: National Weather Service Honolulu shore forecast, with Surfline’s per-spot estimate as the cross-check. Surf outlook and hourly wind: National Weather Service. Spot wind, swell, rating, tides, the best window and the wave height chart: Surfline. Ocean warnings: National Weather Service Honolulu. Brown water and sewage notices: Hawai‘i Department of Health, Clean Water Branch. Buoys: NOAA National Data Buoy Center. Swell map and forecast scorecard: PacIOOS SWAN Oahu wave model, University of Hawai‘i. Official, public sources lead; Surfline is kept as a second opinion so an outage or a bad model run on either side never takes the report down. Each spot’s swell is cross-checked against the buoys every hour, and a reading that can’t be right is replaced with the nearest spot’s. Next 5 days: Surfline’s surf and rating forecast for each spot. Why-it’s-working line and best conditions: our own spot-by-spot local knowledge. Lifeguard hours: Honolulu Ocean Safety. Hazard ratings: Safe Beach Day (Hawaii Lifeguard Association). UV index: U.S. EPA. Lineup photos and video: local surfers, credited on each shot.
Chun's Reef
Forecast — next 11 days
| TodayOct 4 | MonOct 5 | TueOct 6 | WedOct 7 | ThuOct 8 | FriOct 9 | SatOct 10 | SunOct 11 | MonOct 12 | TueOct 13 | WedOct 14 | |
|---|---|---|---|---|---|---|---|---|---|---|---|
| AM | 2–311/24 mph | 3–411/21 mph | 2–36/13 mph | 5–65/10 mph | 5–64/7 mph | 3–512/18 mph | 3–512/18 mph | 3–512/18 mph | 3–512/18 mph | 3–512/18 mph | 3–512/18 mph |
| PM | 3–415/30 mph | 3–412/20 mph | 3–47/17 mph | 5–611/14 mph | 4–510/13 mph | 3–512/18 mph | 3–512/18 mph | 3–512/18 mph | 3–512/18 mph | 3–512/18 mph | 3–512/18 mph |
Swells in the water
| From | Height | Period |
|---|---|---|
| ENE 59° | 4.7 ft | 6 s |
| NNE 13° | 2.1 ft | 8 s |
| NNW 339° | 1.2 ft | 11 s |
| SW 219° | 0.8 ft | 12 s |

When it works
Best window today: Best 4–6 PM — rated fair then, poor to fair the rest of the day.
- SwellN to NNW
- Size1–6 ft face
- Tideany tide
Wind — next 36 hours
Tide today
Buoys — measured
Waimea Bay buoy (NOAA 51201): 3.9 ft at 8 s from the N · water 80°F
Safety
Hazards: Check conditions with the lifeguards before paddling out
Map & directions
Ideal conditions
N to NNW
Light E to SE trades or calm
1–6 ft face
any tide
About Chun's Reef
Chun's is a mellow right-hand reef between Laniakea and Waimea. It's one of the friendlier North Shore waves: easy-going rights that suit longboards, fishes and progressing surfers on small to medium swells.
Good for improving surfers when small; stronger on bigger swells.
Friendly by North Shore standards.
Popular, especially on weekends and longboard days.
Fun, forgiving rights.
Easy paddle.
Usually clean.
Reef, currents on bigger swells, crowds on good days
Longboard, Fish, Funboard, Shortboard
Roadside parking off Kamehameha Hwy; cross with care. Paddle out from the beach in front of the reef.
Reef
October through April
Lineup photos & video
 ● Lineup · 22 hours ago